Posts

Showing posts from April, 2015

#84 Question 7

Image
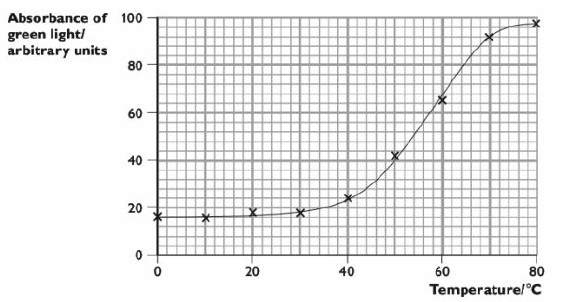
Beetroot cells contain a red pigment that cannot normally escape from the cells through the cell surface membrane. A student carried out an investigation into the effect of temperature on the permeability of the cell surface membrane of beetroot cells. She measured permeability by using a colorimeter to measure the absorbance of green light by the solutions in which samples of beetroot had been immersed. The greater the absorbance, the more red pigment had leaked out of the beetroot cells. The graph above shows her results. (a) With reference to the graph, describe the effect of temperature on the absorbance of light in the colorimeter. (3 marks) (b) With reference to the structure of cell membranes, explain the effects you have described in (a).  (4 marks) (Total 7 marks) Candidate A (a) Between 0 and 30 the absorbance goes up very slightly .  ü  Above 40°C it goes up very quickly.  û  Then it starts to level out at about 70°C . ü * The student has correctly identified the three ma

#83 Question 6

Image
The diagram below shows pressure changes in the left atrium and left ventricle of the heart and the aorta during the cardiac cycle. (a) Calculate how many heart beats there will be in one minute. (2 marks) (b) (i) On the diagram, indicate the point at which the semilunar valves in the aorta snap shut. (1 marks)       (ii) Explain what causes the semilunar valves to shut at this point in the cardiac cycle. (2 marks)       (iii) On the diagram, indicate the period when the left ventricle is contracting. (1 mark)      (iv) On the diagram, draw a line to show the changes in pressure in the right ventricle. (2 marks) (c) After the blood leaves the heart, it passes into the arteries. The blood pressure gradually reduces and becomes more steady as the blood passes through the arteries. Explain what causes this reduction and steadying of the blood pressure. (2 marks) (Total 10 marks) Candidate A (a) 1 cycle in 0.75 seconds  ü  so in 60 seconds there will be 60 x 0.75  û  - 45 beats * The

#82 Question 5

Image
The diagram below shows a small part of a human lung as it appears through a microscope. (a) Name the type of blood vessel in which the red blood cell is present. (1 mark) (b) Describe and explain two ways in which the structure of the alveoli, shown in the diagram, enables gas exchange to take place rapidly. (4 marks) (c) Explain why large organisms such as mammals need specialised gas exchange surfaces, whereas small organisms such as a single-celled Amoebo do not. (2 marks) (Total 7 marks) Candidate A (a) capillary  ü * This is correct. 1/1 (b) They have a large surface area  ü      They are thin, so oxygen can diffuse across quickly ü * The statement about a large surface area is correct, but the answer also needs to say why this enables gas exchange to take place rapidly (because the question asks you to 'explain'). The second answer is not sufficiently clear - what is thin? It is not the whole alveoli that are thin, but their walls. The second part of this answer doe

#81 Question 4

Image
The diagrams below show five molecules found in living organisms. (a) Give the letter of one molecule that fits each of these descriptions. You can use each letter once, more than once or not at all.    (i) the form in which carbohydrates are transported through phloem tissue in plants (1 mark)    (ii) the form in which carbohydrates are stored in animals (1 mark)    (iii) a molecule that is insoluble in water (1 mark)    (iv) a molecule that links together with others to form a polypeptide (1 mark)    (v) a molecule that contains ester bonds (1 mark) (b) Explain how the structure of water molecules makes water a good solvent. (3 marks) (Total 8 marks) Candidate A (a) (i) A   û     * A is a glucose molecule, but plants transport sucrose. Even if you did not know  what a sucrose molecule looks like, you should know that it is a disaccharide.    (ii) C ü    * Correct. 1/1    (iii) E  û    * Amino acids are soluble. Either C or D would be correct.    (iv) E  ü     *  Correct. 1/1  

#80 Question 3

Image
(a) The diagrams show a cell in various stages ofthe mitotic cell cycle. Name the stage represented by each diagram, and arrange them in the correct sequence. (b) Describe the role of spindle microtubules in mitosis. (3 marks) (c) The graph below shows the changes in the mass of DNA per cell and total cell mass during two cell cycles. Different vertical scales are used for the two lines. (i) On the graph, write the letter D to indicate a time at which DNA replication is taking place.  (1 mark) (ii) On the graph, write the letter C to indicate a time at which cytokinesis is taking place. (1 mark) (d) Describe the roles of mitosis In living organisms. (3 marks) Total: 11 marks Candidate A (a) A metaphase,  ü  B prophase,  ü C telophase,  ü  D anaphase  ü *  The candidate has named each stage correctly, but has not arranged them in the correct order. 2/3 (b) The spindle microtubules pull the chromatids to opposite ends of the cell.  ü * This is correct, but there is not enough here for

#79 Question 2

Image
The diagram shows the bacterium Mycobacterium tuberculosis, which causes tuberculosis (TB). (a) M . tuberculosis is taken up by macrophages and multiplies inside them. Suggest how this strategy could help to protect M. tuberculosis from the immune response by B cells. (3 marks) (b) In an experiment to investigate how M tuberculosis avoids destruction by macrophages, bacteria were added to a culture of macrophages obtained from the alveoli of mice. At the same time, a quantity of small glass beads, equivalent in size to the bacteria, were added to the culture. The experiment was repeated using increasing quantities of bacteria and glass beads. After 4 hours, the macrophages were sampled to find out how many had taken up either glass beads or bacteria. The results are shown in the graph. The x-axis shows the initial ratio of bacteria or glass beads to macrophages in the mixture. Discuss what these results suggest about the ability of macrophages to take up M. tuberculosis . (3 marks

#78 Question 1

Image
(a) The diagram shows a small part of a cell, as seen using an electron microscope.       (i) Name the parts labelled A to D.   (2 marks)       (ii) Describe how part B is involved in the formation of extracellular enzymes. (3 marks) (b) Give two reasons, other than the presence of part B, why the cell in the diagram cannot be a prokaryotic cell. (2 marks) Total: 7 marks Candidate A (a) (i) A plasma membrane  ü           B  Golggi  ü          C nucleus  û          D phagocyte  û * C is the nuclear envelope (or membrane), not the nucleus itself. A phagocyte is a cell - perhaps the candidate is thinking of a phagocytic vesicle. 1/2     (ii) First, the enzymes are made by protein synthesis on the ribosomes. Then they go into the endoplasmic reticulum. Then they are taken  ü to the Golgi where they are packaged. Then they go in vesicles  ü to the cell membrane where they are sent out byexocytosis. * This candidate has not really thought about exactly what the question was asking, an

#77 Questions and answers

Image
In this section is a practice examination paper, similar to the Cambridge International AS Level Biology paper 2. All of the questions are based on the topic areas described in the previous sections. Youhave 1 hour and 15minutes to do the paper. There are 60 marks on the paper, so you can spend just over one minute per mark. If you find you are spending too long on one question, then move on to another that you can answer more quickly. If you have time at the end, then come back to the difficult one. Some of the questions require you to recall information that you have learned. Be guided by the number of marks awarded to suggest how much detail you should give in your answer. The more marks there are, the more information you need to give. Some of the questions require you to use your knowledge and understanding in new situations. Don't be surprised to find something completely new in a question - something you have not seen before. Just think carefully about it, and find something

#76 Summary of Practical Skills

Image
1 In an experiment investigating the effect of one variable on another, the independent variable is the one that you change and the dependent variable is the one that you measure. All other variables should be controlled (kept constant).  2 The range of the independent variable is the spread from lowest to highest value. The interval is the distance between each value in the range.  3 Temperature can be kept constant or varied using a water bath. pH can be kept constant or varied using buffer solutions.  4 The accuracy of a measurement is how true it is. For example, an accurate measuring cylinder reads exactly 50 cm3  when it contains 50 cm 3  of liquid. c  5 The precision of a measuring instrument is how consistent it is in giving exactly the same reading for the same value.  6 The reliability of a set of measurements is the degree of trust that you can have in them. A reliable set of measurements are likely to be very similar if you are able to do the same experiment again. If you a

#75 Drawings

Image
One of the questions in the exam is likely to involve drawing a specimen on a slide, using a microscope, or drawing from a photomicrograph (a photograph taking through a microscope). Making decisions about what to draw You might have to decide which part of a micrograph to draw. For example, there might be a micrograph of a leaf epidermis, and you are asked to draw two guard cells and four epidermal cells. It is really important that you do exactly as you are asked and choose an appropriate part of the micrograph. Producing a good drawing It is very important that you draw what you can see, not what you think you ought to see. Forexample, during your AS course you may have drawn a TS of a stem where the vascular bundles were arranged in a particular way, or were a particular shape. In the exam, you could be asked to draw a completely different type of vascular bundle that you have never seen before. Look very carefully and draw what you can see. Your drawing should: • be large and draw

#74 Identifying sources of error

Image
It is very important to understand the difference between experimental errors and 'mistakes'. A mistake is something that you do incorrectly, such as misreading the scale on a thermometer, or taking a reading at the wrong time, or not emptying a graduated pipette fully. Do not refer to these types of mistake when you are asked to comment on experimental errors. You've already seen, on post # 70  , that every measuring instrument has its own built-in degree of uncertainty in the values you read from it. You may remember that, in general, the size of the error is half the value of the smallest division on the scale. Errors can also occur if there were uncontrolled variables affecting your results. For example, if you were doing an investigation into the effect of leaf area on the rate of transpiration, and the temperature in the laboratory increased while you were doing your experiment, then you can't be sure that all the differences in rate of transpiration were entirely